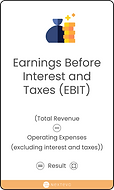
Key Performance Indicator Cards


Our KPI Cards are tailored to aid in AI Opportunity Mapping, providing a clear and concise overview of essential business metrics.
They help in identifying and understanding key KPIs, crucial for measuring the effectiveness of AI strategies. These cards ensure that your AI initiatives are aligned with specific business goals, facilitating informed decision-making.

Accounts Receivable Turnover
This KPI measures how effectively a company collects debts from its customers. A higher turnover rate indicates efficient collection practices, suggesting that the company is quick in converting its receivables into cash. This is crucial for maintaining cash flow and reducing the risk of bad debts.
Net Credit Sales ÷ Average Accounts Receivable = Result (Times)

Accounts Payable Turnover
This KPI assesses how quickly a company pays off its suppliers. A higher turnover rate indicates that the company is paying its suppliers rapidly, which could be a sign of good supplier relationships and also potential for discounts. Conversely, a lower turnover might indicate delayed payments, which can sometimes be used as a cash flow management strategy.
Cost of Goods Sold ÷ Average Accounts Payable = Result (Times)

Inventory Holding Period
This KPI calculates the average number of days a company holds inventory before selling it. A shorter period is often preferable, suggesting efficient inventory management and a faster turnover, which is vital for reducing holding costs and freeing up working capital.
(Average Inventory ÷ Cost of Goods Sold) × 365 = Result (Days)

Total Revenue Growth Rate
This KPI measures the rate at which a company's revenue is growing from one period to the next. It's a critical indicator of the company's market performance and overall growth. Companies aim for a higher growth rate to demonstrate improved market position and business expansion.
(Current Period Revenue - Previous Period Revenue) ÷ Previous Period Revenue × 100 = Result (%)

Market Share
This KPI indicates the company's portion of total sales in its market. A higher market share often suggests a strong market position and competitive advantage. It's crucial for understanding a company’s influence and success in its industry relative to its competitors.
Company's Sales ÷ Total Market Sales × 100 = Result (%)

Break-Even Point
This KPI calculates the number of units a company must sell to cover its costs, with no profit or loss. It's essential for understanding the sales volume needed to ensure financial viability and for setting sales targets and pricing strategies.
Fixed Costs ÷ (Unit Selling Price - Variable Cost per Unit) = Result (Units)

Working Capital
This KPI represents the difference between a company’s current assets and current liabilities. Positive working capital indicates that a company can fund its current operations and invest in future activities, making it a critical measure of short-term financial health.
Current Assets - Current Liabilities = Result (Currency)

Capital Expenditure (CapEx)
This KPI tracks the amount of money a company spends on acquiring or maintaining physical assets like buildings, technology, or equipment. It's vital for understanding a company's investment in long-term assets crucial for its growth and operations.
Total Spent on Acquiring or Upgrading Physical Assets = Result (Currency)

Liquidity Ratio
This KPI measures a company's ability to meet its short-term obligations with its most liquid assets. It is a key indicator of financial health, reflecting how well a company can quickly convert its assets into cash to pay off liabilities.
(Cash and Cash Equivalents + Short-Term Investments + Accounts Receivable) ÷ Current Liabilities = Result (Ratio)

Dividend Payout Ratio
This KPI calculates the percentage of net income distributed to shareholders in the form of dividends. It's an important measure for investors, indicating how much profit a company returns to shareholders versus reinvesting back into the business.
Dividends Paid ÷ Net Income = Result (%)
