Key Performance Indicator Cards


Our KPI Cards are tailored to aid in AI Opportunity Mapping, providing a clear and concise overview of essential business metrics.
They help in identifying and understanding key KPIs, crucial for measuring the effectiveness of AI strategies. These cards ensure that your AI initiatives are aligned with specific business goals, facilitating informed decision-making.

Gross Profit Margin
This KPI indicates the percentage of revenue that exceeds the cost of goods sold, serving as a critical measure of production efficiency and pricing strategy. A high Gross Profit Margin suggests that the company is selling products well above their production costs, which can be a sign of strong market positioning and effective cost control.
(Total Revenue - Cost of Goods Sold) ÷ Total Revenue × 100 = Result (%)

Net Profit Margin
This KPI measures the percentage of revenue that remains as profit after all operating expenses, interest, and taxes are paid. It's crucial for assessing overall profitability, indicating how well a company manages its expenses and operates its core business.
Net Profit ÷ Total Revenue × 100 = Result (%)

Operating Cash Flow
This KPI reflects the cash generated from the company's regular business operations, highlighting the company's ability to generate sufficient cash to maintain and expand operations. It's vital for evaluating the company's liquidity and long-term viability.
Net Income + Non-Cash Expenses + Changes in Working Capital = Result (Currency)

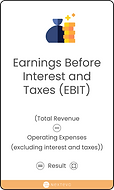
Earnings Before Interest and Taxes (EBIT)
This KPI assesses a company's profitability from its core operations, excluding the effects of interest and tax expenses. EBIT provides a clear view of the operational efficiency and profitability, which is particularly useful for comparing companies across different tax environments.
Revenue - Operating Expenses (excluding interest and taxes) = Result (Currency)

Earnings Before Interest, Taxes, Depreciation, and Amortisation (EBITDA)
This KPI extends EBIT by also excluding non-cash expenses like depreciation and amortisation. EBITDA offers an understanding of the company's operational profitability before accounting allocations and financial deductions, providing insights into its operational cash flow.
EBIT + Depreciation + Amortisation = Result (Currency)

Return on Investment (ROI)
This KPI evaluates the efficiency of an investment, measuring the return relative to the investment’s cost. It's a versatile tool used to compare the efficiency of several different investments, providing a simple percentage that can easily be compared across different sectors or industries.
(Net Profit / Investment Cost) × 100 = Result (%)

Return on Equity (ROE)
This KPI measures a company's ability to generate profits from its shareholders' equity. ROE is a crucial indicator of financial performance, reflecting how effectively management is using a company’s assets to create profits.
Net Income ÷ Shareholder's Equity × 100 = Result (%)

Debt to Equity Ratio
This KPI compares a company’s total liabilities to its shareholders' equity. It's a measure of the degree to which a company is financing its operations through debt versus wholly owned funds, offering insights into its financial leverage and stability.
Total Liabilities ÷ Shareholder's Equity = Result (Ratio)

Current Ratio
This KPI assesses a company's ability to pay off its short-term liabilities with its short-term assets. The Current Ratio is an indicator of liquidity, providing a snapshot of the company’s financial health and its ability to meet short-term obligations.
Current Assets ÷ Current Liabilities = Result (Ratio)

Quick Ratio (Acid-Test Ratio)
This KPI measures a company's ability to meet its short-term obligations with its most liquid assets, excluding inventory. The Quick Ratio is a stringent test of liquidity and can provide a more accurate picture of a company's short-term financial health in situations where inventory cannot be easily converted to cash.
(Current Assets - Inventory) ÷ Current Liabilities = Result (Ratio)
